Track Profit & Revenue
See how your shop is performing at a glance. Revenue, profit, items sold — with comparisons to previous periods.
Dashboard overview
The Analyze page shows your key metrics: total revenue, profit, number of items sold, and average sale price for the selected period.
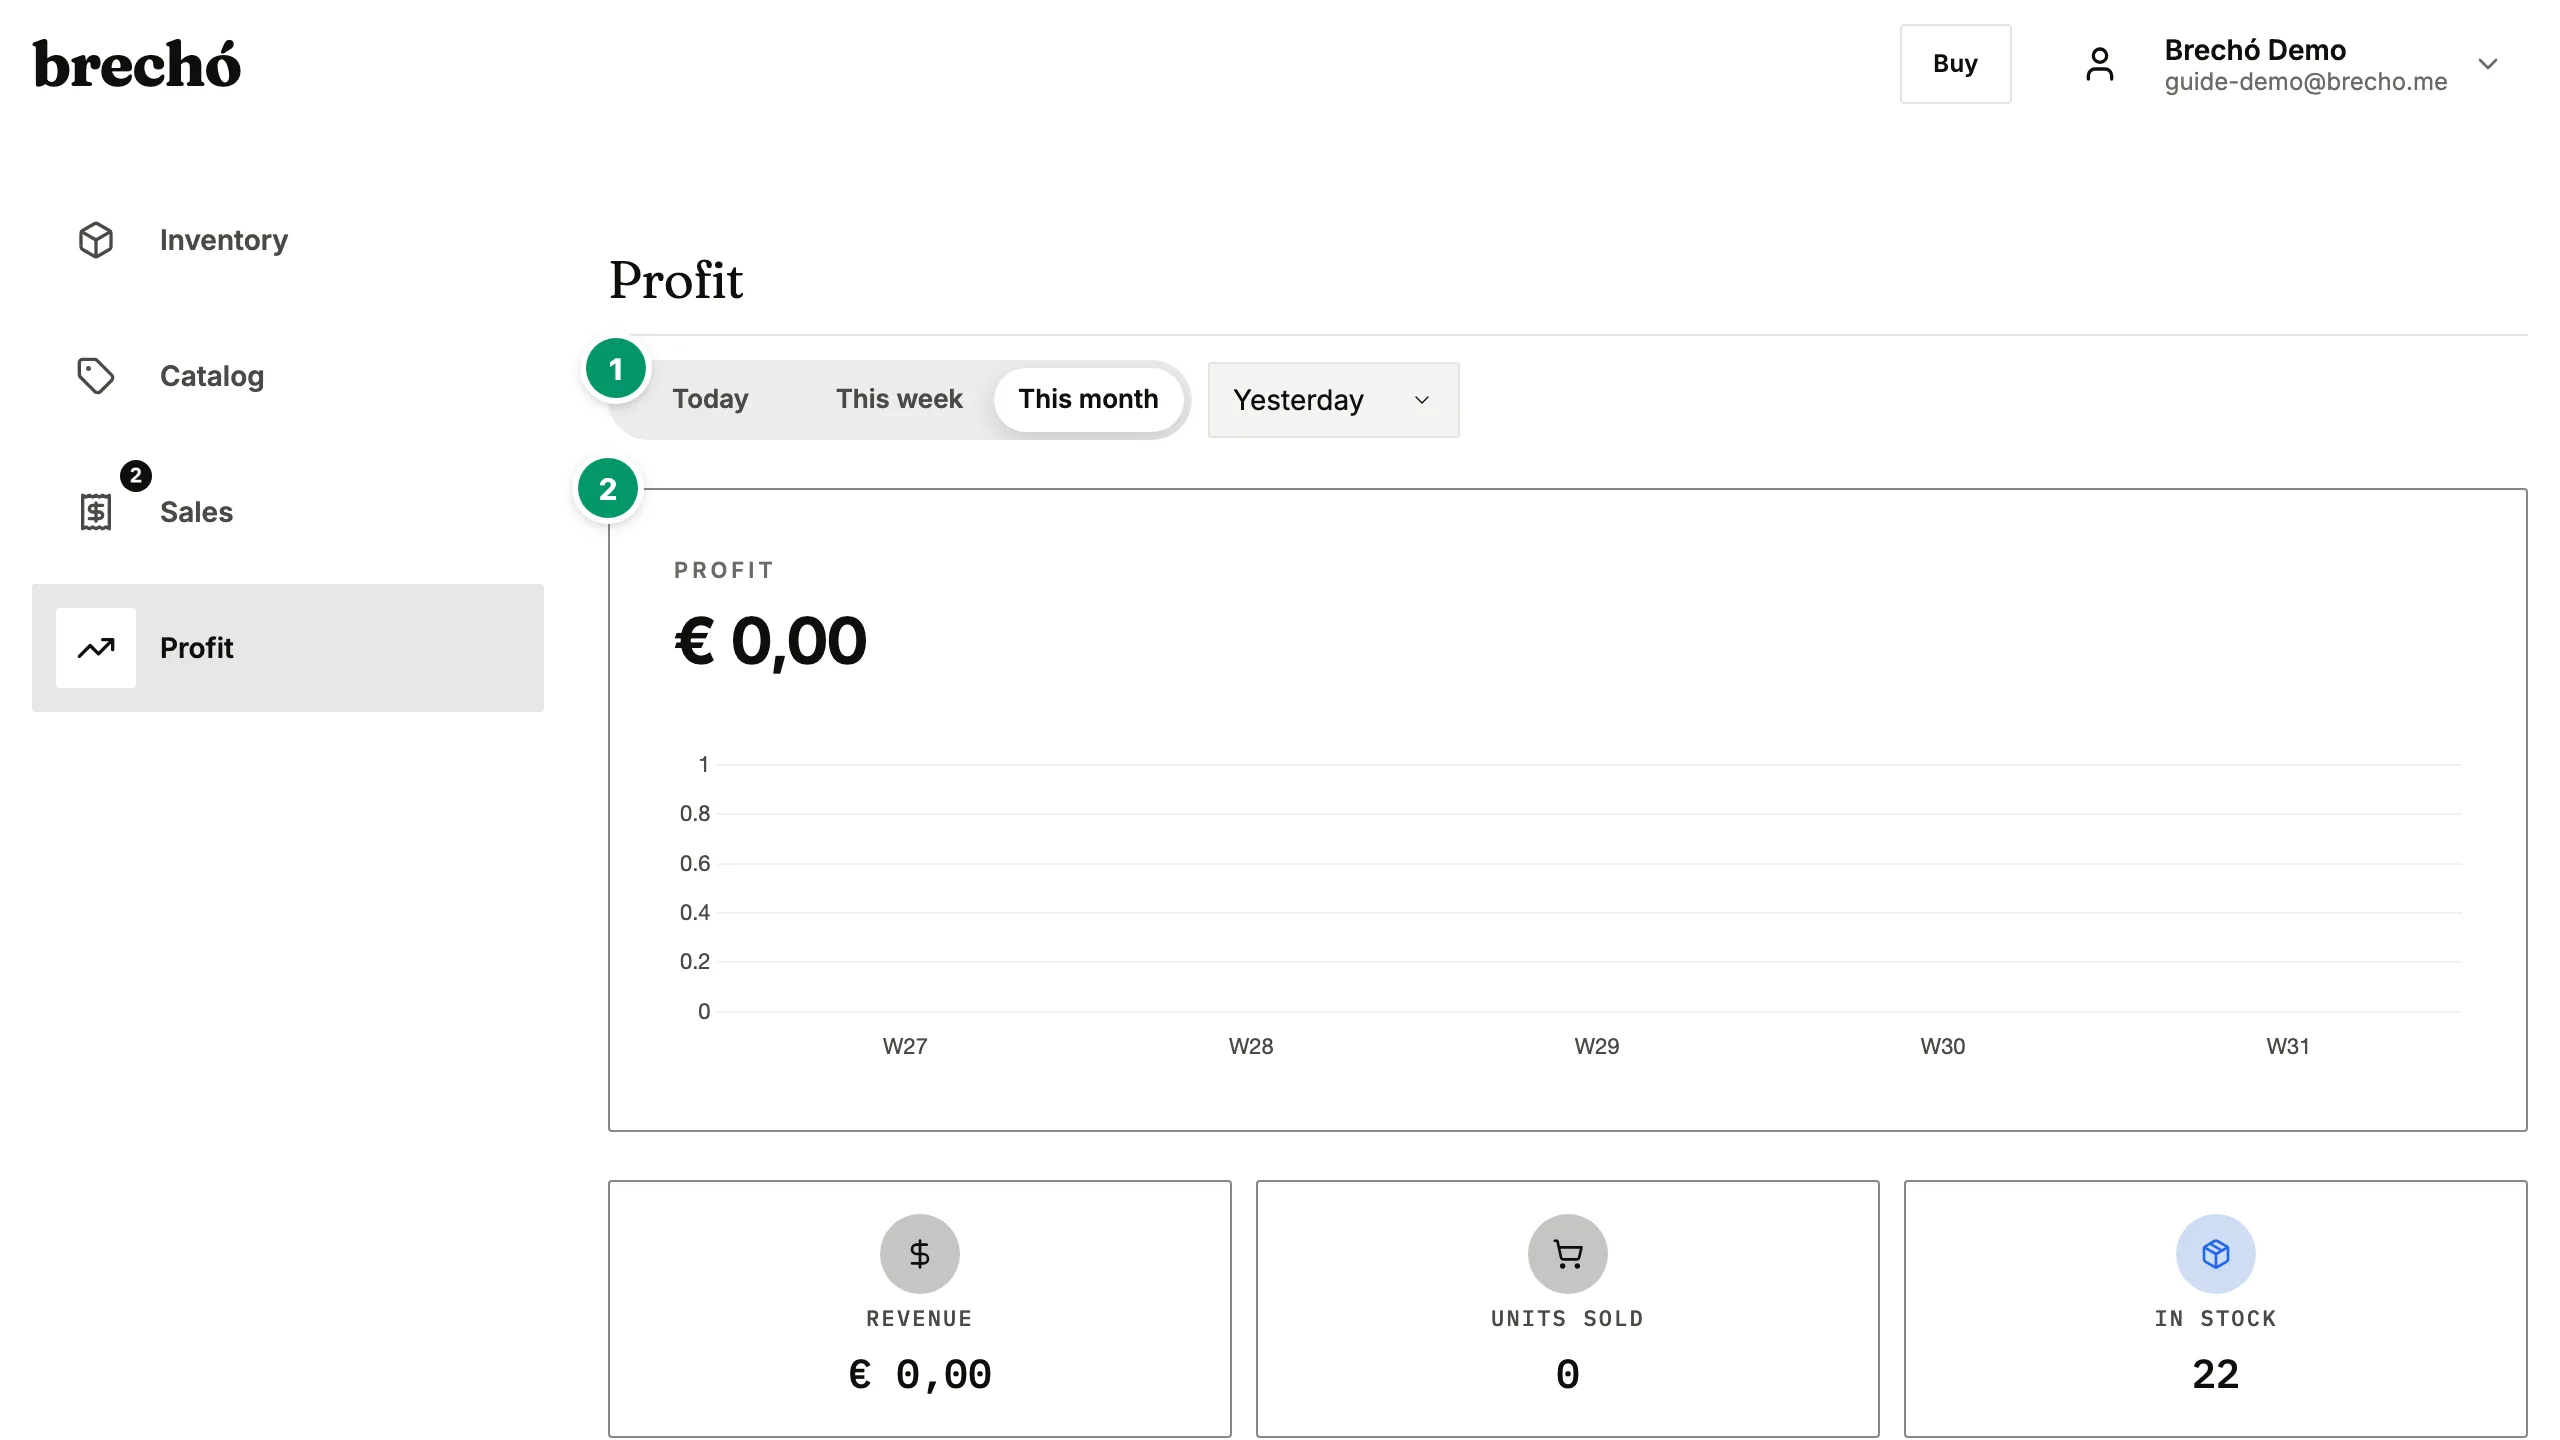
- 1 Dashboard overview
- 2 Compare periods
Compare periods
Switch between today, this week, this month, or custom ranges. See how each metric compares to the previous period.
Profit tracking
Toggle between actual profit (what you've already received) and expected profit (including pending payments). See profit per item and margins.
Frequently Asked Questions
How is profit calculated?
Profit = sale price minus cost price (from your original order). Fees from payment providers are also subtracted when available.
Can I export my data?
Not as a downloadable file today. Every number on the Analyze dashboard — revenue, profit, margin, items sold — is live in the app and can be filtered by any date range, so you always have the current figures without a separate export step. For a full copy of your account data, which is your right under LGPD and GDPR, contact us at [email protected] and we will send it to you.
Can I filter profit data by product category or selling channel?
Yes. Use the period selector to compare today, this week, this month, or custom date ranges — all revenue and profit metrics update instantly. Drill into individual items to see which pieces are most profitable, helping you decide what to restock and what to reprice for better secondhand shop margins.
Can I see which items have the highest profit margin?
Yes. The item-level view shows every sold piece with its profit amount and margin percentage. Filter by period to surface your best-performing items this week, this month, or any custom range. Sorting by margin helps you identify which product types, price points, or suppliers give the best returns — so you can restock what works and reprice what doesn't.
How do I find inventory that has been unsold for a long time?
Use the Inventory page — filter by In Stock status and sort by import date to surface your oldest pieces. Items that have sat unsold the longest are candidates for repricing or a flash sale — tap any item to update its price on the spot. Many sellers review aged stock monthly and move slow items via WhatsApp payment links at a reduced price.
Can I compare profit across different suppliers to find my best-performing sources?
Yes. Each item in your profit analysis links back to its original purchase order and supplier. Filter the item-level view to compare items from different suppliers side by side — you will see which source produces the highest margins after landed cost. Whether you import from AliExpress, buy at wholesale markets, or work with consignment partners, brecho.me tracks landed cost per supplier so you can restock from your most profitable channels.
Can I generate a profit and loss report for accounting or tax season?
Yes. From the Analyze page, select any date range — a calendar year, a quarter, or a custom period — and view total revenue, total cost, and net profit for that period, broken down to the item level: purchase date, sale date, cost price, landed cost, sale price, payment method, and net profit per piece. Share these screens with your accountant, or, under LGPD and GDPR, request a full export of your account data at any time by contacting us at [email protected].
Can I see how much I spent on stock versus how much profit I earned over a period?
Yes. The Analyze dashboard shows total cost of stock sold alongside total revenue and net profit for any period you select. This gives you a clear spend-versus-return picture: how much went out to suppliers and how much came back as profit after all costs. For a fuller view of stock investment including items not yet sold, go to Inventory and check the total cost column for in-stock items — together, these two totals give you the full monthly or quarterly picture.
How do I identify which product categories or item types give me the best profit margins?
Filter the item-level view in Analyze by time period to compare sold items, then review the margin percentage per item. Patterns emerge quickly: vintage denim may outperform fast-fashion accessories, or a specific supplier may consistently produce better margins. Use this insight to guide your next buying trip or sourcing decision. On the Analyze page, the all-items view lets you rank by profit amount or margin percentage to identify top performers at a glance.
How do I track my profit trend over time to see if my shop is growing?
Use the Analyze period selector to compare consecutive periods — this week versus last week, this month versus last month, or custom date ranges. Revenue, profit, and items sold all show the change from the previous period as a percentage, so you can spot a growing or declining trend at a glance. Tracking profit trend monthly is more informative than revenue alone — a month with high revenue but thin margins points to a pricing or cost problem that revenue figures would miss. Most sellers review their Analyze dashboard weekly to catch slow-moving stock before it ties up too much capital.
What does sell-through rate mean and how do I improve it for my secondhand shop?
Sell-through rate is the percentage of your inventory that has sold within a given period — if you have 100 items and sold 38, your sell-through is 38%. It shows how efficiently stock is turning over. A rate below 20% over 30 days typically signals items that are overpriced, poorly photographed, or not matching buyer demand. To improve it: review the Analyze page for items with the longest time in stock and reprice or promote them via WhatsApp payment links. Items missing photos or with thin descriptions sell slower — completing those details in the product catalog is the fastest fix. For your fastest-selling categories, restock promptly to keep inventory turning. Most healthy secondhand shops target 30–60% sell-through per month on active listings.
Can I see which selling channel — marketplace, payment links, or in-person POS — earns me the most profit?
Yes. The Analyze dashboard breaks down revenue and profit by sales channel: marketplace orders, payment link sales, and POS terminal transactions each appear separately. Filter by channel to compare average sale price and profit margin side by side. Many secondhand sellers find payment link sales have higher margins than marketplace sales because there are no marketplace fees. This view helps you decide where to focus your selling effort — which channel to grow and which to optimize pricing on.
How do I calculate the total amount I invested in stock this year versus the total profit I earned?
Open Analyze and set the period to 'This year' or use a custom date range from January 1. The summary cards show total revenue, total cost of goods sold, and net profit for the selected period. Total cost of goods sold is your stock investment for items that sold in the period — not items still in inventory. For total investment including unsold stock, go to Inventory, filter by In Stock, and check the total cost column — that is your landed cost still tied up in stock on hand. Subtract total COGS shown in Analyze from that figure to see the full amount invested in unsold inventory. This gives you a clear view of cash in versus cash out for tax season or annual business review.
How do I use my sales data to plan how much new stock to buy for the next season?
Review the last 90 days of sales in Analyze to see your average sell-through rate and revenue per week. Divide total items sold by the number of active weeks to get your average weekly unit sales — this tells you how many items move in a typical week. Multiply by the number of weeks until your next buying cycle ends to estimate your minimum restock quantity. For example, if you sell 12 items per week and your next supplier visit is in 8 weeks, you need at least 96 items to maintain supply through that period. Use the item-level view to see which categories sell fastest and adjust your buying mix toward those: if denim sells at twice the rate of tops, buy more denim — fast-moving categories are safe to restock aggressively, and slow ones should be bought more conservatively.
How do I work out which price range sells the fastest in my shop so I can focus my buying budget where it converts best?
Use Analyze with a period filter. Open Analyze and pick a period — this month, last month, this year — and read the revenue, profit, and units-sold figures for that window. Then scroll to the recent individual sales and go through the items sold in the same period, grouping them into price bands by hand — for example R$0–50, R$51–100, R$101–200 — and counting how many sold in each band. The band that clears quickly while contributing well to the period's profit is your fastest-converting range and the best target for your next buying trip. There is no spreadsheet export today, so this review happens inside the app — the sales run newest-first, which makes a month's banding a few minutes of work. Many secondhand sellers find that mid-range items — R$80–150 in Brazil or €30–60 in Europe — sell fastest because they are affordable enough for impulse purchases but priced high enough for meaningful profit. Concentrate spend in the range that clears fastest and invest less in the ranges that linger.
Ready to try it?
Start managing your secondhand shop today. No credit card required.